|
Data Entry
|   |
|
Data Entry
| |
Screen Layout...
Reports
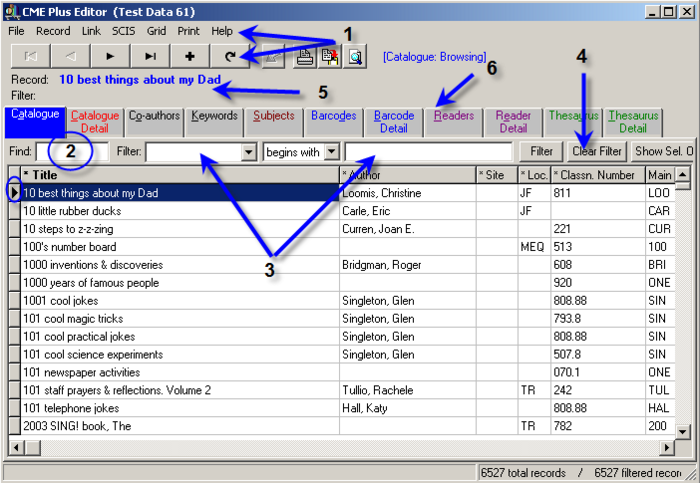
There is a basic Report Generator built into the Data Entry catalogue display grid (sounds complicated but how else can I describe the columns of data listed on the screen when you first pop into the Data Entry module?!) All you need to do is manipulate the data being displayed by using the Fiter option and multi-select / Display Selected Only options and then organise the columns as you would like to see them on paper. Click the little Printer button towards the top of the screen, make a few decisions and view your report. Make adjustments as necessary and then once you're happy with the layout you can save the look of the screen by clicking the Grid bar menu item up the top of the screen and following your nose... (although your eyes will prove more useful taking currently available technology into consideration!)
If you have a copy of the Voice Tutorials CD you might like to check out the Data Entry reports demos to help you find your feet. This Report Generator is very handy to be able to use easily.
Data Grid
The columns of this screen always popup in a standard way... but that doesn't mean they have to stay that way! Feel free to use your mouse to change column widths and even move them around if necessary. You can save your customised look by clicking on the Grid option up on the bar menu which you can then recall whenever it is useful to do so. (I tend to move the columns as necessary because it is quite quick to do once you are familiar with the process). How the grid looks is how the Report will look if you hit the little Printer button towards the top/middle of the screen.